


Total carbohydrate
Ranked 2 of 6
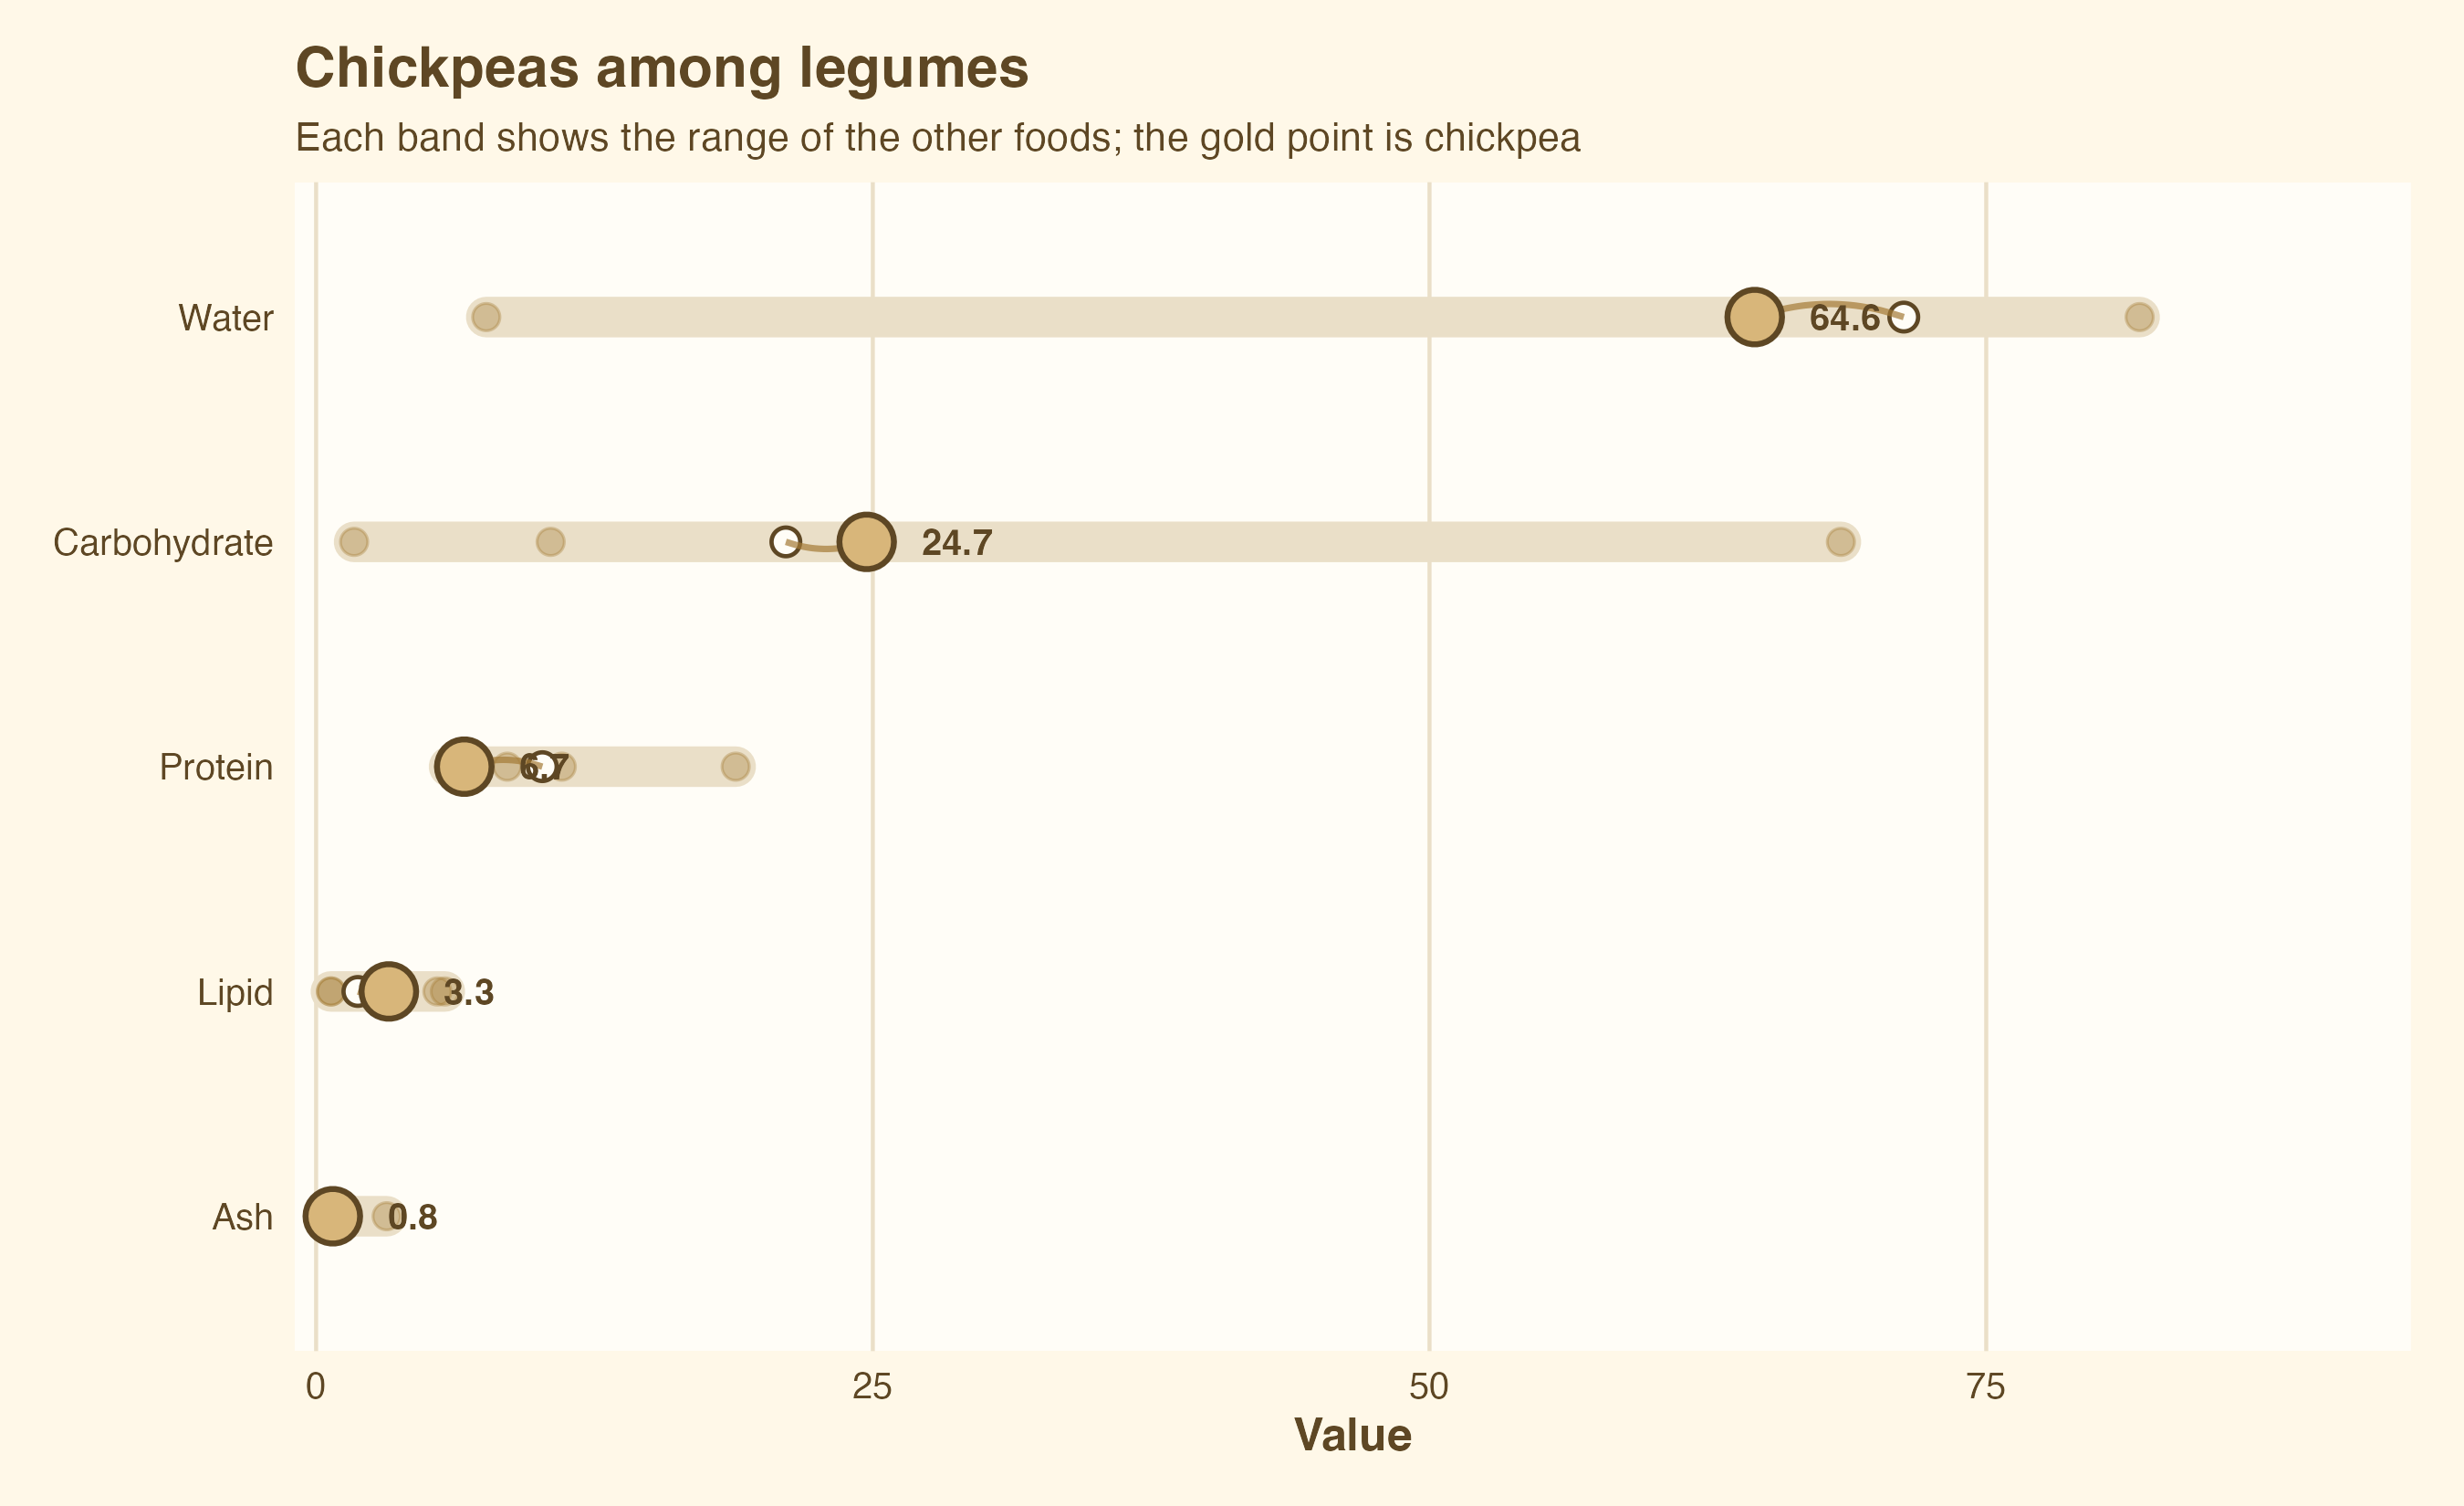
blackeyed pea
68.48
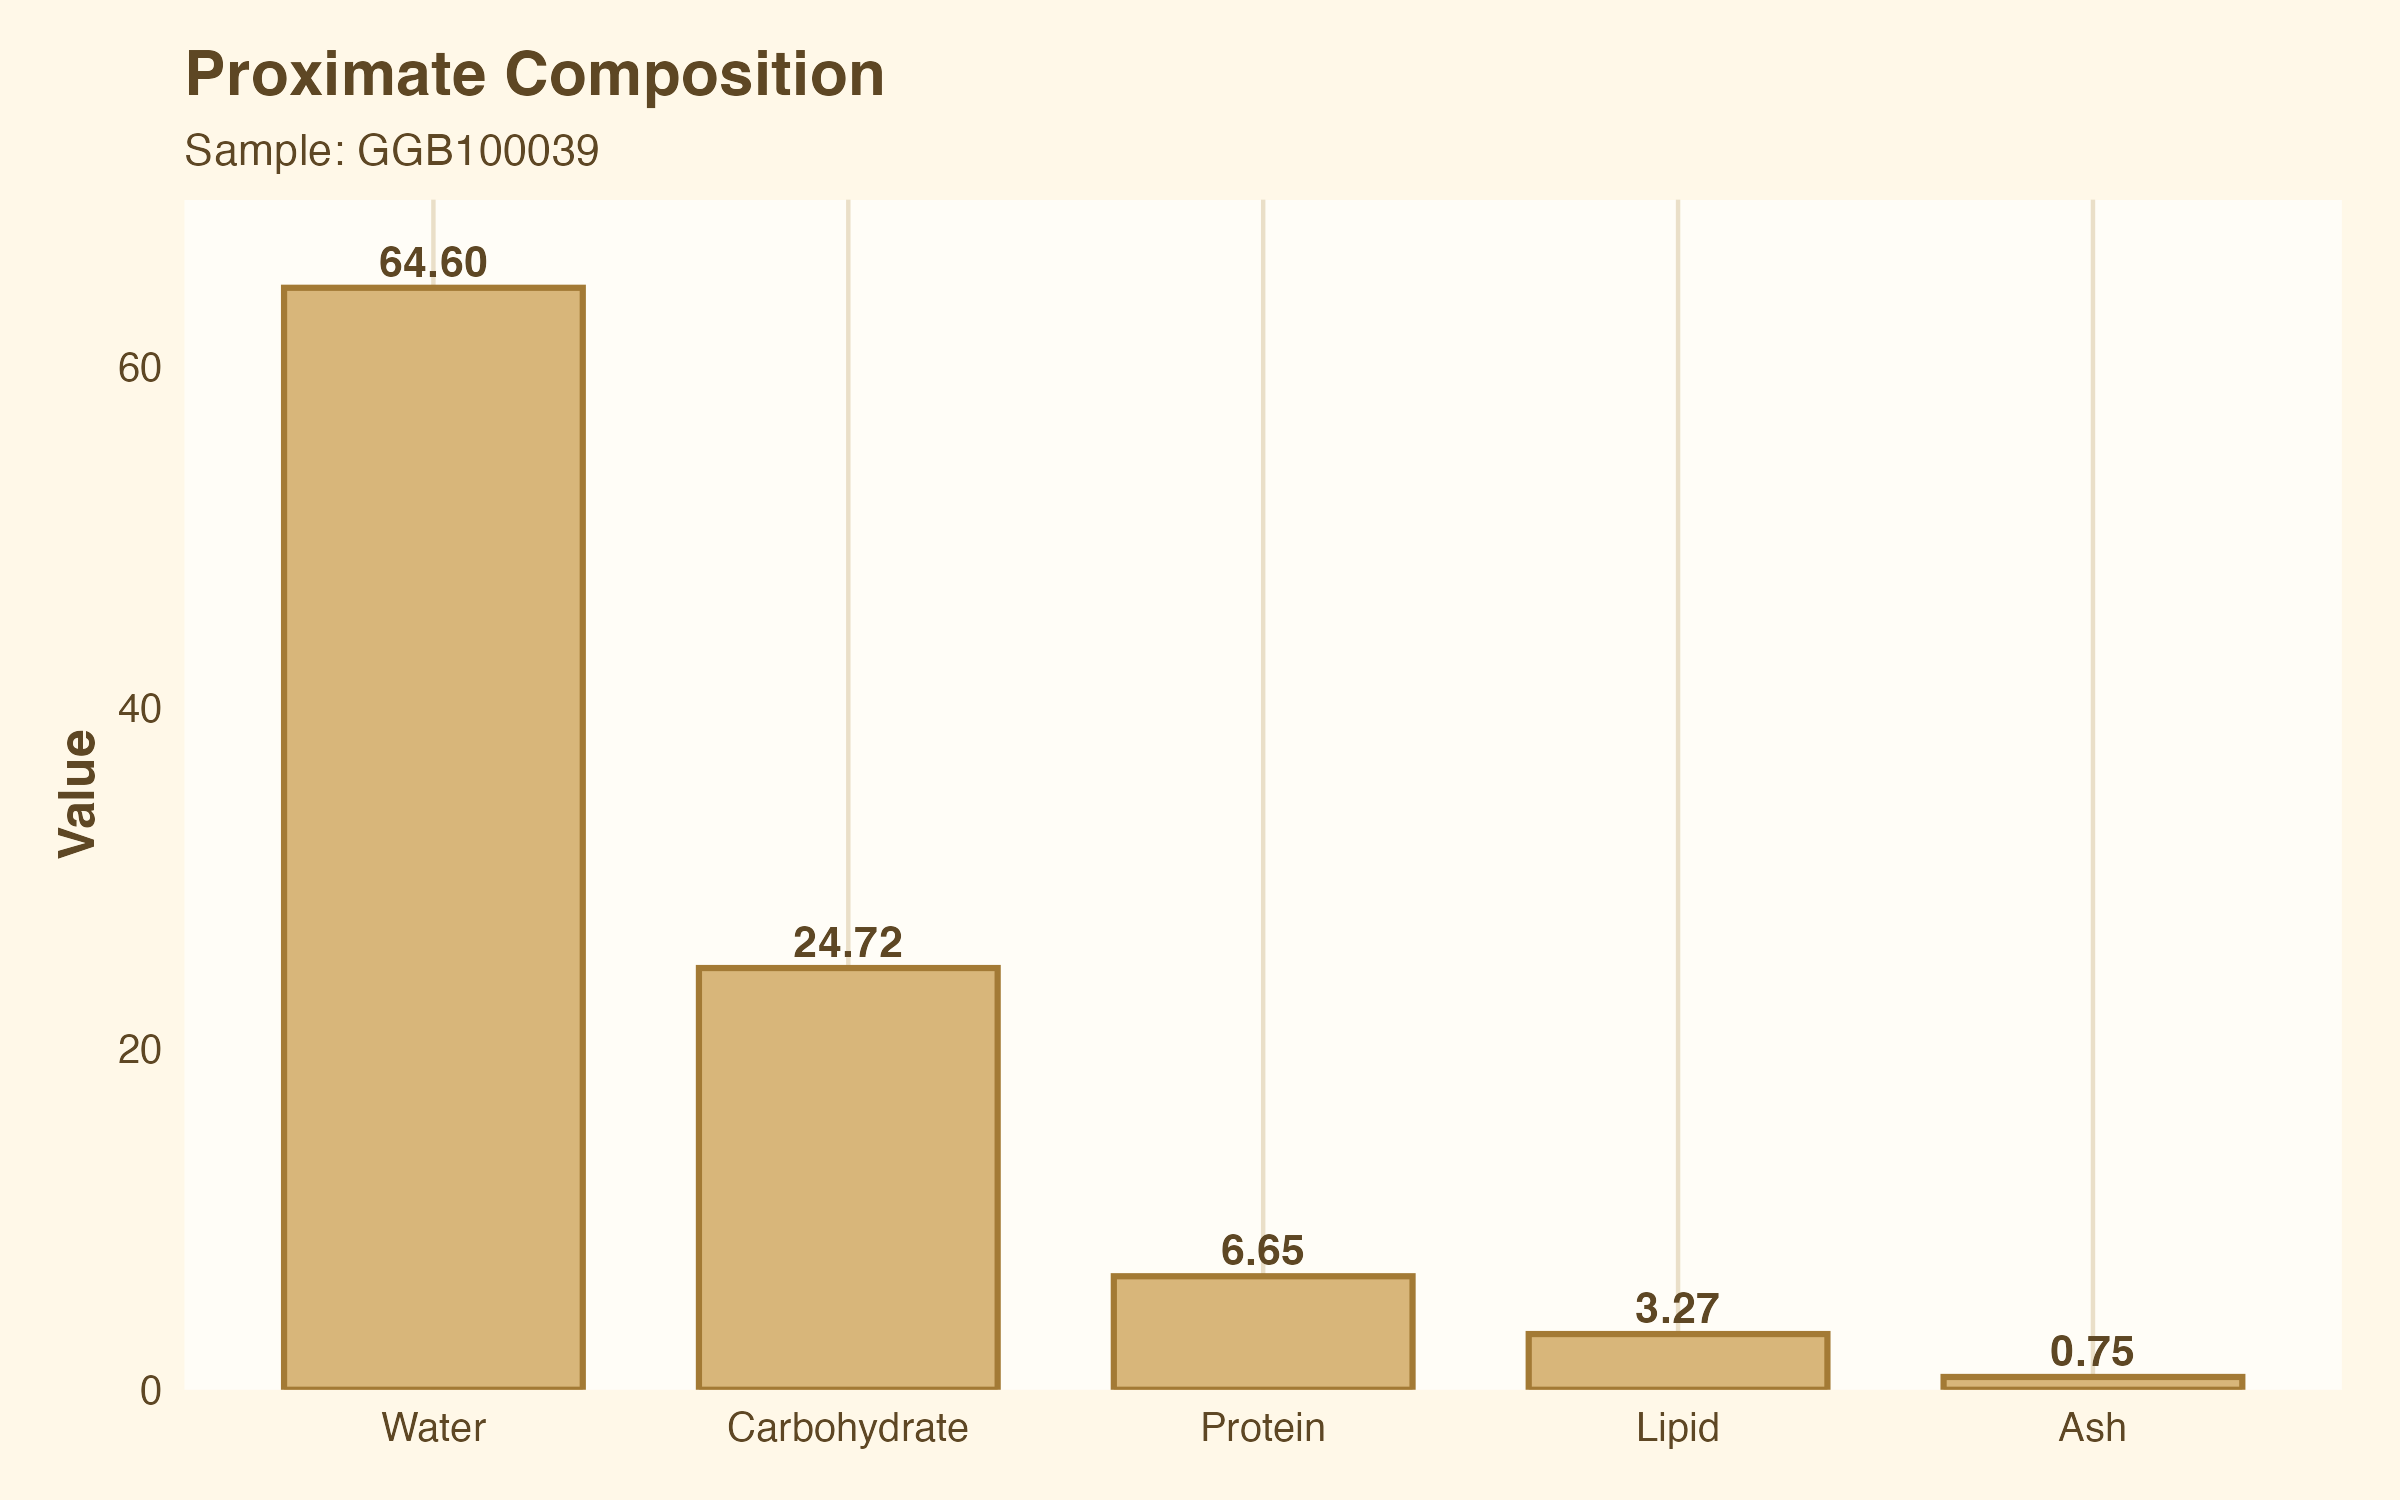
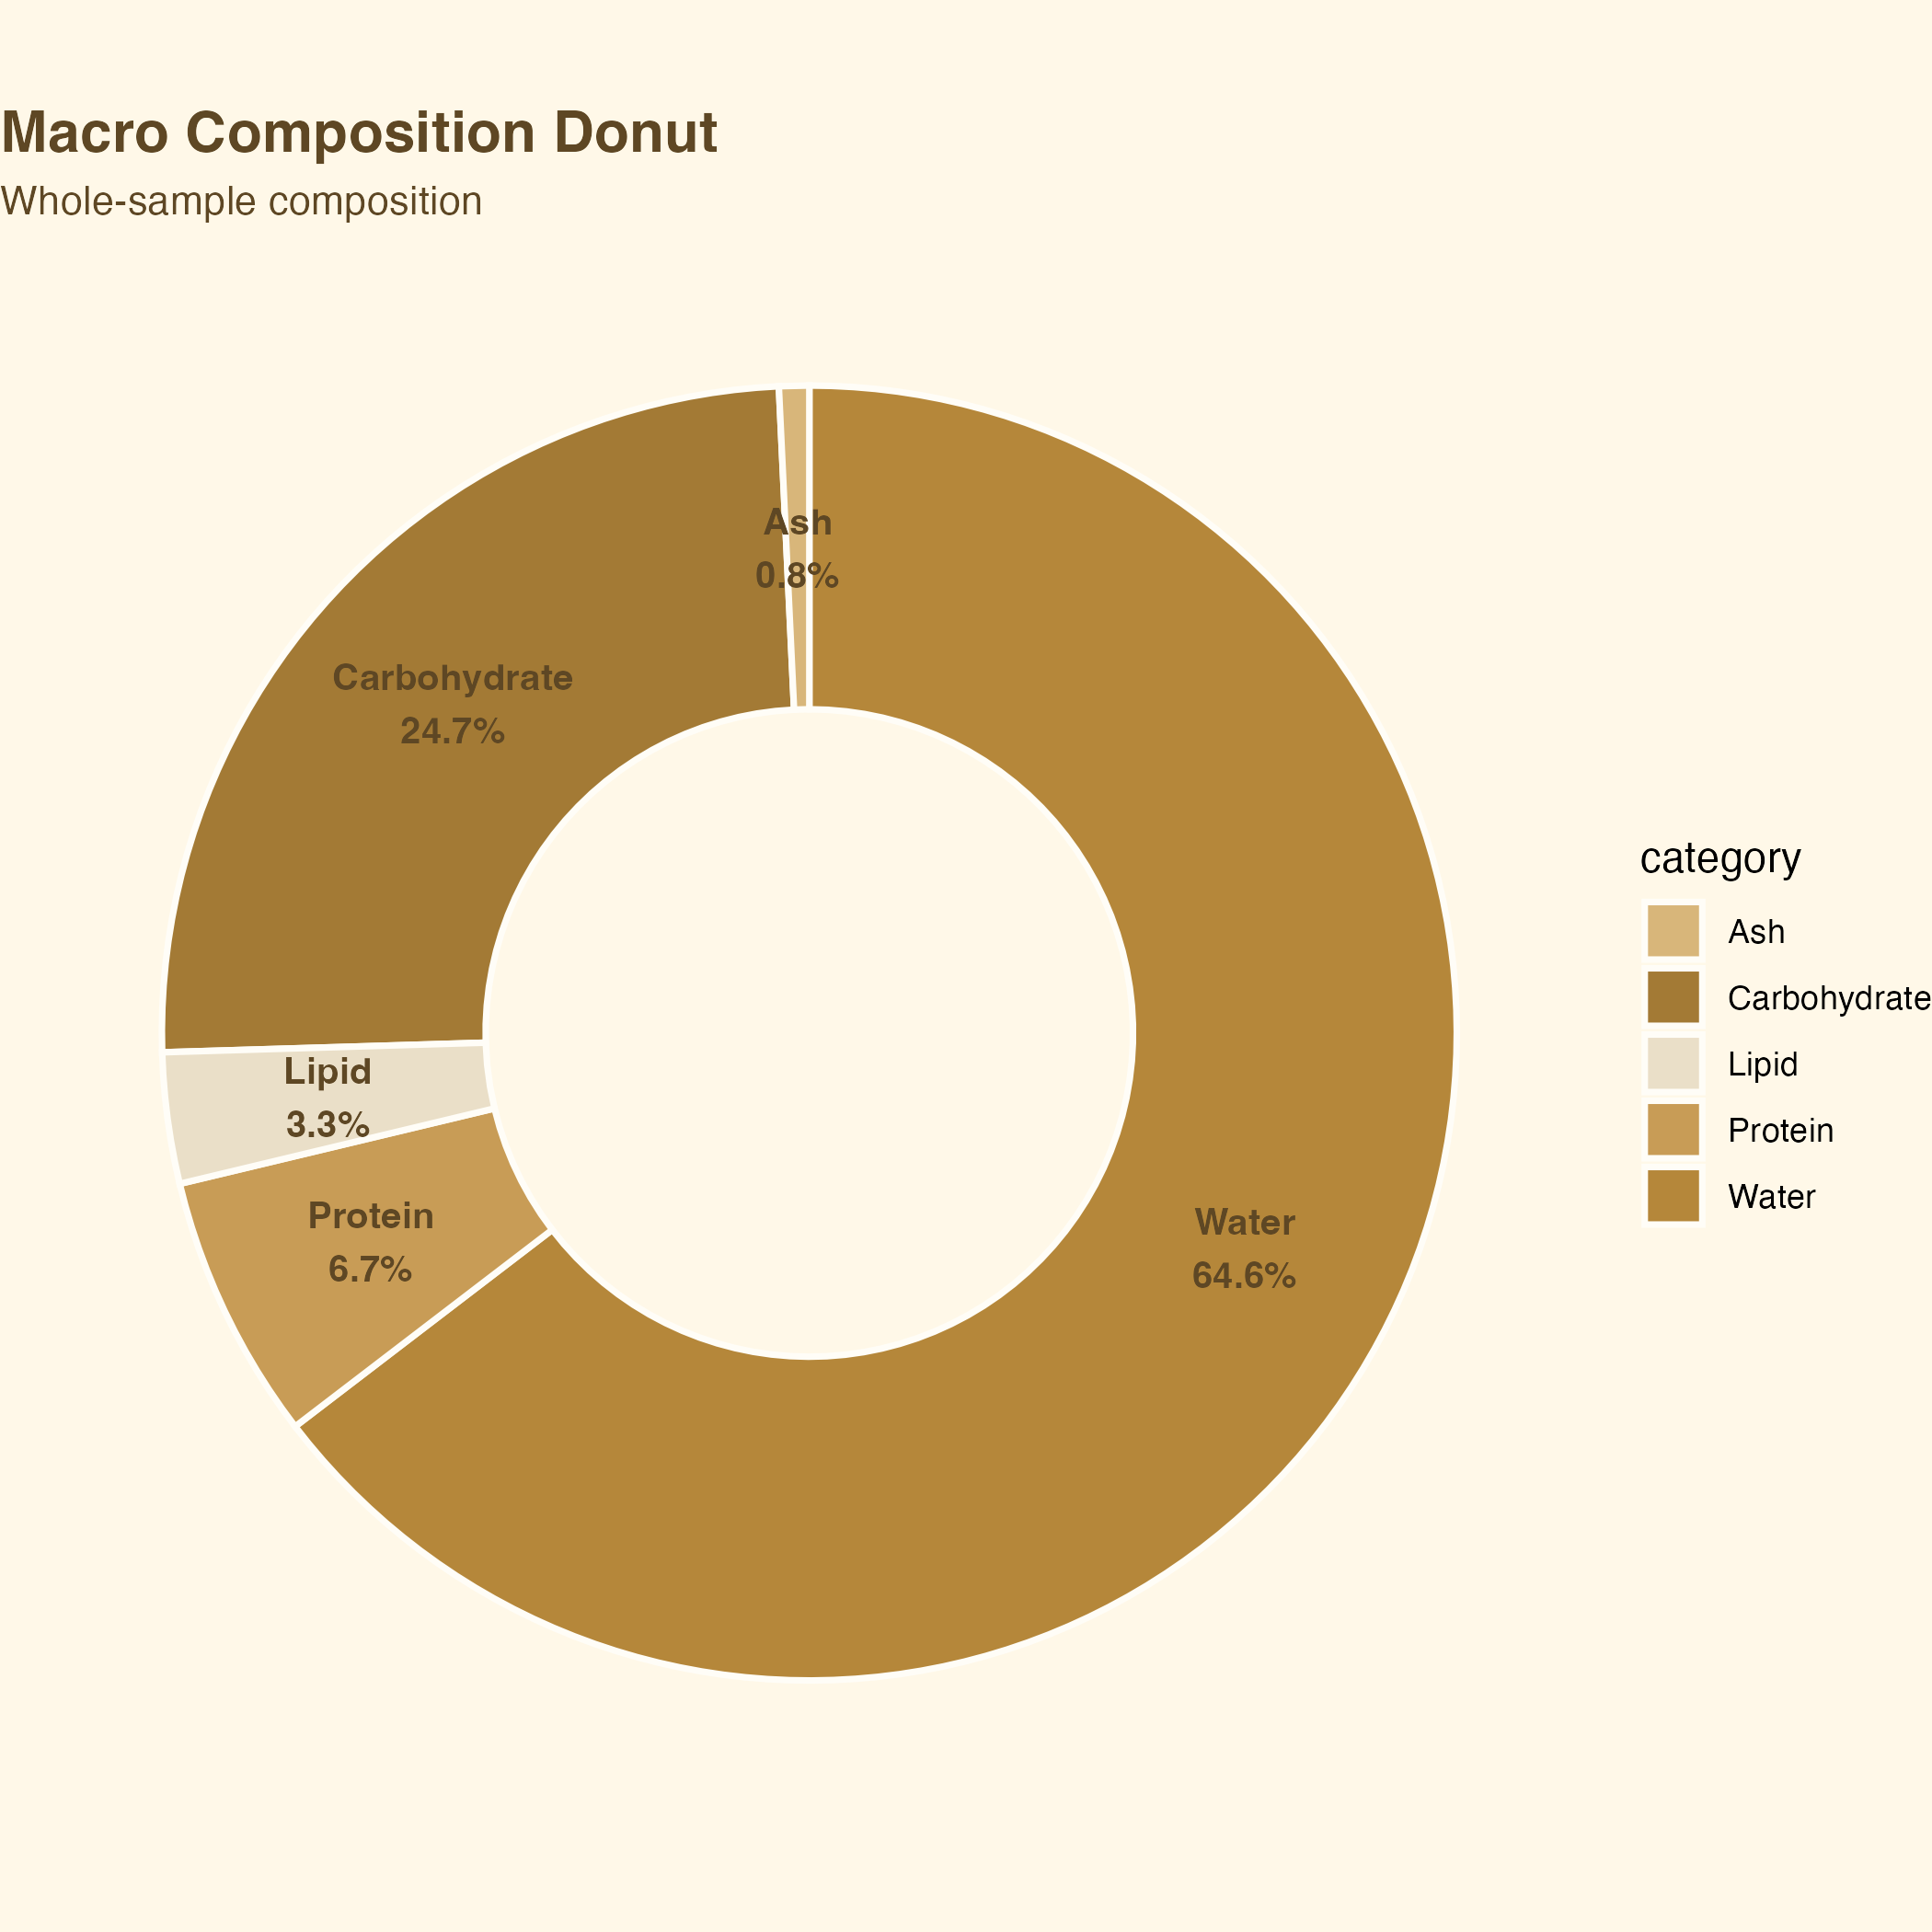
chickpea
24.72
brown lentil (cooked)
24.62
pinto bean (cooked)
21.10
edamame pod (raw)
10.53
extra firm tofu (raw)
1.71